The city has asked schools to test water in their drinking taps for levels of lead
The city has asked schools to test water in their drinking taps for levels of lead. Below is a table of lead levels based on random sampling conducted in fours schools (measured in parts per billion). An ANOVA analysis was performed on the data.

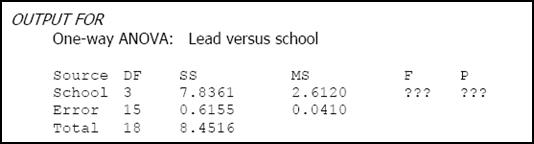
a) Use the values from the ANOVA output above to determine if the data provide sufficient evidence to indicate a difference in mean levels of lead between the schools. Show your hypotheses. You will need to determine the missing values for the ANOVA output (those things indicated by ???).
b) Compare the mean lead levels in School B and School C. Use a 95% confidence interval.
Solution: (a) We need to test the following hypotheses:
![]()
First, the F-ratio is
![]()
The p-value for 3 and 15 degrees of freedom is p = 0.000. Since the p-value is less than the significance level, we reject the null hypothesis of equal means.
(b) We have the following table:

The 95% confidence interval for![]() is given by
is given by

where the pooled standard deviation is computed as

This means that the confidence interval is

This means that there is a probability of 0.95 that the interval![]() contains the actual value of
contains the actual value of![]() . This means that the mean of school B is significantly higher than the mean of school C.
. This means that the mean of school B is significantly higher than the mean of school C.
Related Content

Combining Efforts with a Statistics Expert - StatisticsHelp

Statistics Help: Where To Find it? - StatisticsHelp
